I gave recently a talk at Devoxx France 2015 with Colin Surprenant and I’d like to share here some of the examples we used for the talk.
The talk was about “what my data look like?”.
We said that our manager was asking us to answer some questions:
- who are our customers?
- how do they use our services?
- what do they think about us on Twitter?
Our CRM database
So we have a PostgreSQL database containing our data. We created live a Java application which fetch our data, convert them to JSON and send them to elasticsearch.
We started from an existing code which is able to connect to our database using Hibernate. We have already annotated beans which represent our model.
public class CrmApp {
    public static void main(String[] args) throws Exception {
        CrmFactory.sessionFactory();
        HibernateService hibernate = new HibernateService();

        int from = 1;
        boolean haveRecords = true;

        // While we have data to get, we read 10 000 records in the database
        while (haveRecords) {
            hibernate.beginTransaction();
            Criteria criteria = hibernate.getSession().createCriteria(Person.class);
            criteria.setFirstResult(from);
            criteria.setMaxResults(10000);
            List<Person> persons = criteria.list();
            for (Person person : persons) {
              // We have a person here
            }
            hibernate.commitTransaction();

            if (persons.size() == 0) {
                haveRecords = false;
            } else {
                from += 10000;
            }
        }
        CrmFactory.close();
    }
}
The first thing to do is to add elasticsearch as a dependency to the project in our pom.xml file:
<dependency>
    <groupId>org.elasticsearch</groupId>
    <artifactId>elasticsearch</artifactId>
    <version>1.5.0</version>
</dependency>
We will also use Jackson library to serialize our documents in JSON:
<dependency>
    <groupId>com.fasterxml.jackson.core</groupId>
    <artifactId>jackson-databind</artifactId>
    <version>2.3.5</version>
</dependency>
We first need to create an elasticsearch client. We will use here a Transport Client :
// Create a transport client with cluster.name=devoxx and default IP/Port
Client esClient = new TransportClient(
    ImmutableSettings.builder().put("cluster.name", "devoxx")
  ).addTransportAddress(
    new InetSocketTransportAddress("127.0.0.1", 9300)
  );
We can either index documents one by one but this is super inefficient. The best way for doing that is by using the BulkProcessor class which is provided by elasticsearch. A Bulk will basically execute a given set of requests (index, update or delete) instead of executing each request indivdually:
// Create a bulk processor
BulkProcessor bulk = BulkProcessor.builder(esClient, new BulkProcessor.Listener() {
  @Override
  public void beforeBulk(long executionId, BulkRequest request) { }

  @Override
  public void afterBulk(long executionId, BulkRequest request, BulkResponse response) { }

  @Override
  public void afterBulk(long executionId, BulkRequest request, Throwable failure) { }
})
  // We will send the bulk every 10 000 requests
  .setBulkActions(10000)
  // We will send the bulk every 5 seconds even if we don't have 10 000 requests
  .setFlushInterval(TimeValue.timeValueSeconds(5))
  .build();
Let’s create an ObjectMapper to serialize into JSON:
// Create Jackson mapper
ObjectMapper mapper = new ObjectMapper();
And now, we just have to send every single object we get from the database to elasticsearch:
for (Person person : persons) {
    // Serialize our bean to a JSON (as bytes or String)
    byte[] bytes = mapper.writeValueAsBytes(person);
    // Send our JSON to elasticsearch
    // index name will be "persons", type is "person" and we use our bean id as id
    bulk.add(
      new IndexRequest("persons", "person", "" + person.getId()).source(bytes)
    );
}
We can run our application and check that everything is working fine but running:
curl -XGET localhost:9200/persons/person/_count?pretty
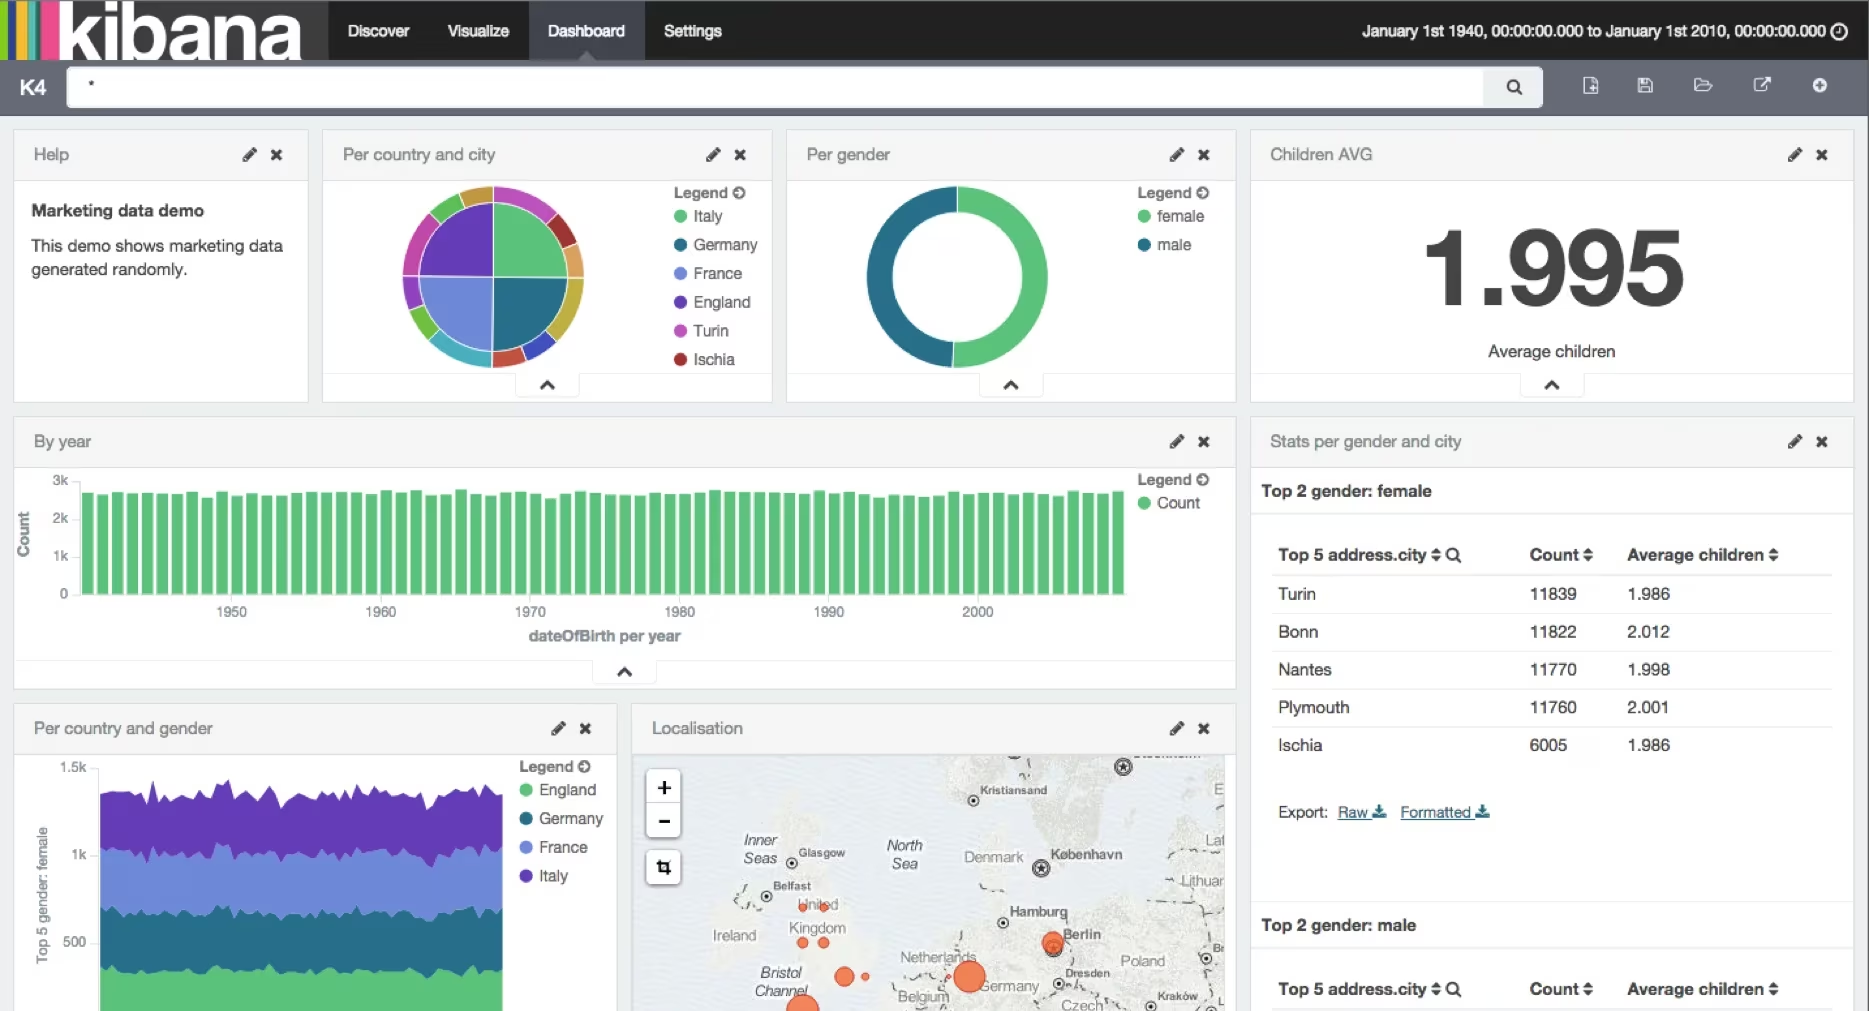
We can also build our Kibana dashboard which represents our customers:

CRM dashboard
Service usage
We have logs coming from nginx as JSON documents:
{
    "agent": "Debian APT-HTTP/1.3 (0.9.7.9)",
    "code": 404,
    "host": "packages.elasticsearch.org",
    "machine": "i-ea96c300",
    "origin": "50.57.209.100",
    "referrer": "-",
    "remote": "10.5.45.194",
    "request": "GET /logstash/1.4/debian/dists/stable/main/i18n/Translation-en_US.bz2 HTTP/1.1",
    "size": 335,
    "time": "2015-03-01T22:00:01+00:00"
}
We have collected one day of data in nginx-logs:
ls nginx-logs
gives
download.log.2015-04-01.00-00-01.i-4548086a.gz
download.log.2015-04-01.00-00-01.i-737c3a89.gz
download.log.2015-04-01.00-00-01.i-8cd72f7c.gz
download.log.2015-04-01.00-00-01.i-951754ba.gz
...
download.log.2015-04-01.23-00-01.i-951754ba.gz
download.log.2015-04-01.23-00-01.i-97783e6d.gz
download.log.2015-04-01.23-00-01.i-c4904b34.gz
As an input, we will use stdin input filter with json_lines codec plugin:
input {
  stdin {
    codec => json_lines
  }
}
We will extract the date from time field, generate information about geo location of the user based on its ip address available in origin field and also get some details about the useragent field:
filter {
  date {
    match => [ "time", "ISO8601" ]
    locale => en
    remove_field => "time"
  }

  geoip {
    source => "origin"
    remove_field => ["remote", "machine"]
  }

  useragent {
    source => "agent"
    target => "useragent"
  }
}
A little trick has been added as a filter. Sometimes, gives back 2 IP addresses in origin field: "origin": "192.168.27.32, 195.214.227.49". We are going to extract only the last part with mutate gsub:
mutate {
  gsub => [
    "origin", ".*, ", ""
  ]
}
Then we just have to send all our data to elasticsearch:
output {
  stdout { codec => dots }
  elasticsearch {
    protocol => "http"
    host => "localhost"
  }
}
Let’s parse our logs with logstash:
gzcat nginx-logs/* | bin/logstash -f nginx.conf
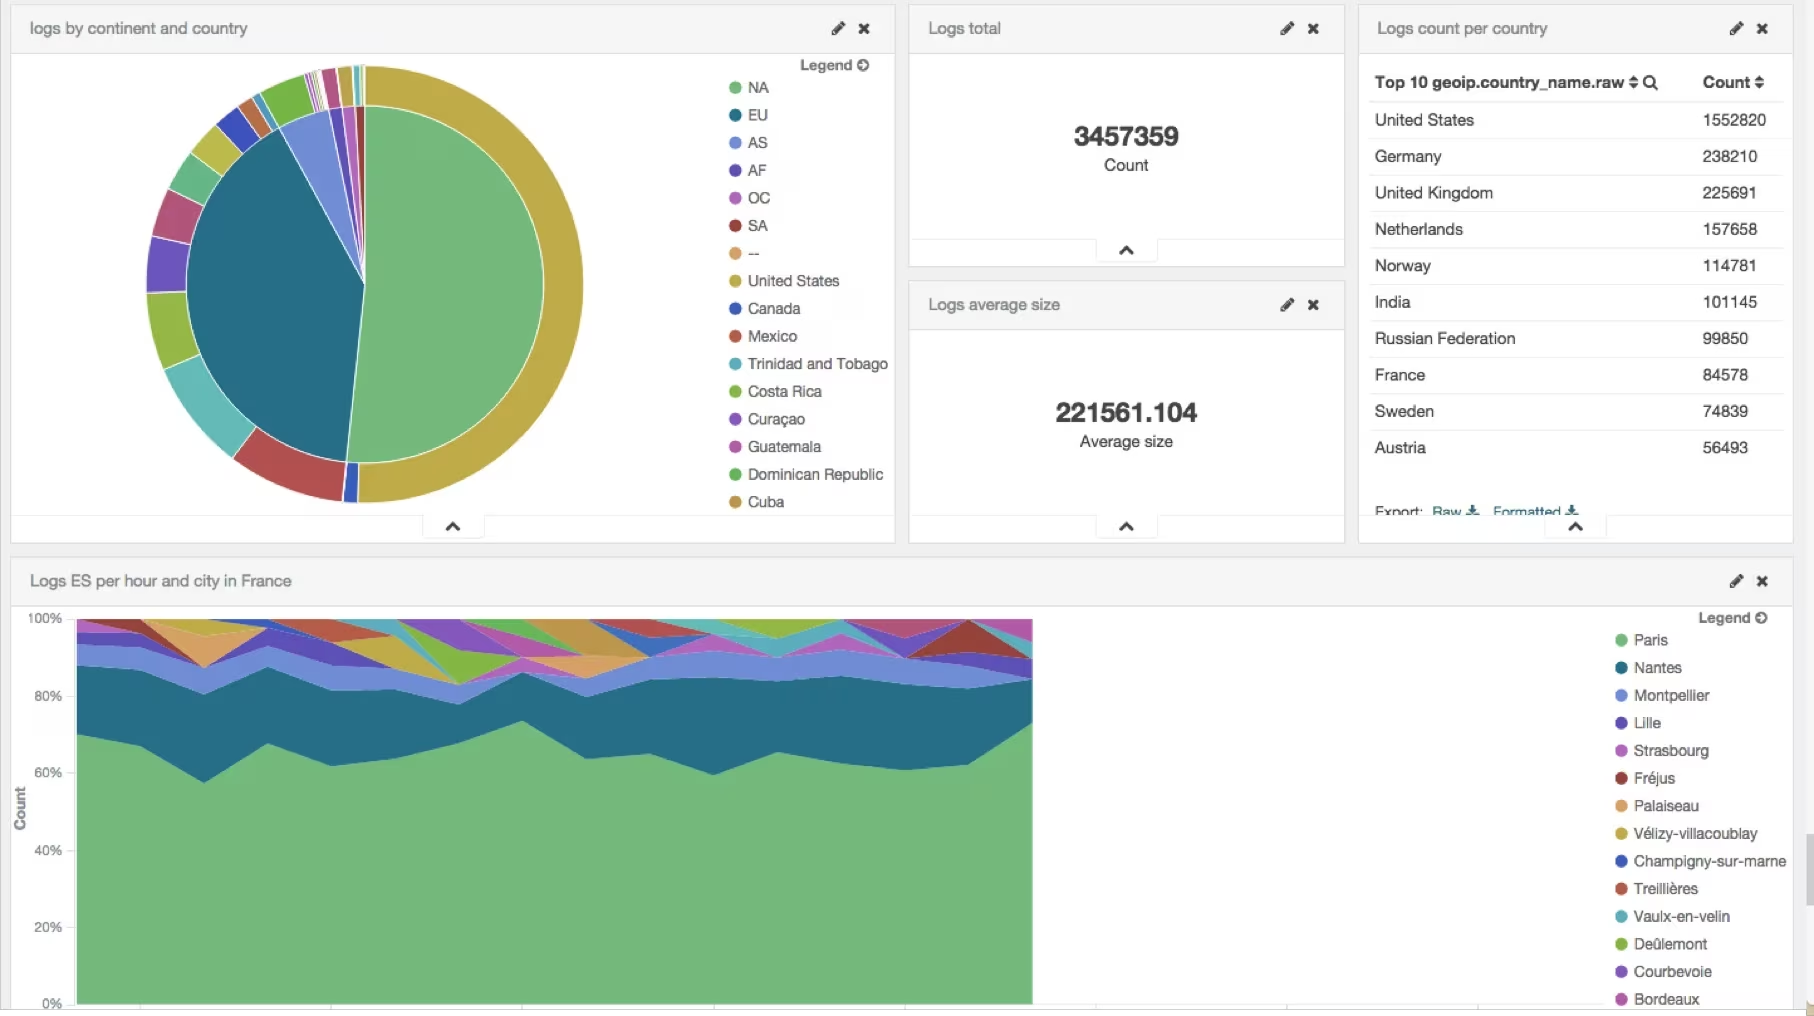
We can now build our Kibana dashboard which represents our logs:

LOGS dashboard
Twitter tracking
We just have to use the Twitter input plugin for that. We will track everything about devoxx, elk, elasticsearch, logstash and kibana and we want to index all fields coming from the twitter API:
input {
  twitter {
      consumer_key => "consumer_key"
      consumer_secret => "consumer_secret"
      oauth_token => "oauth_token"
      oauth_token_secret => "oauth_token_secret"
      keywords => [ "devoxx", "elk", "elasticsearch", "logstash", "kibana" ]
      full_tweet => true
  }
}
We don’t need any filter here:
filter {
}
We will index into elasticsearch but we need to provide a specific index template to define what our mapping will look like:
output {
  stdout { codec => dots }
  elasticsearch {
    protocol => "http"
    host => "localhost"
    index => "twitter"
    index_type => "tweet"
    template => "twitter_template.json"
    template_name => "twitter"
  }
}
twitter_template.json file contains our template. We define that we use 1 single shard, that we don’t need _all field and that we will index coordinates.coordinates field as a geo_point:
{
  "template": "twitter",
  "order":    1,
  "settings": {
    "number_of_shards": 1
  },
  "mappings": {
    "tweet": {
      "_all": {
        "enabled": false
      },
      "properties": {
        "coordinates": {
          "properties": {
             "coordinates": {
                "type": "geo_point"
             },
             "type": {
                "type": "string"
             }
          }
        }
      }
    }
  }
}
Let’s start to listen to Twitter now:
logstash-1.5.0.rc2/bin/logstash -f twitter.conf
For each tweet coming, you will see a dot printed.
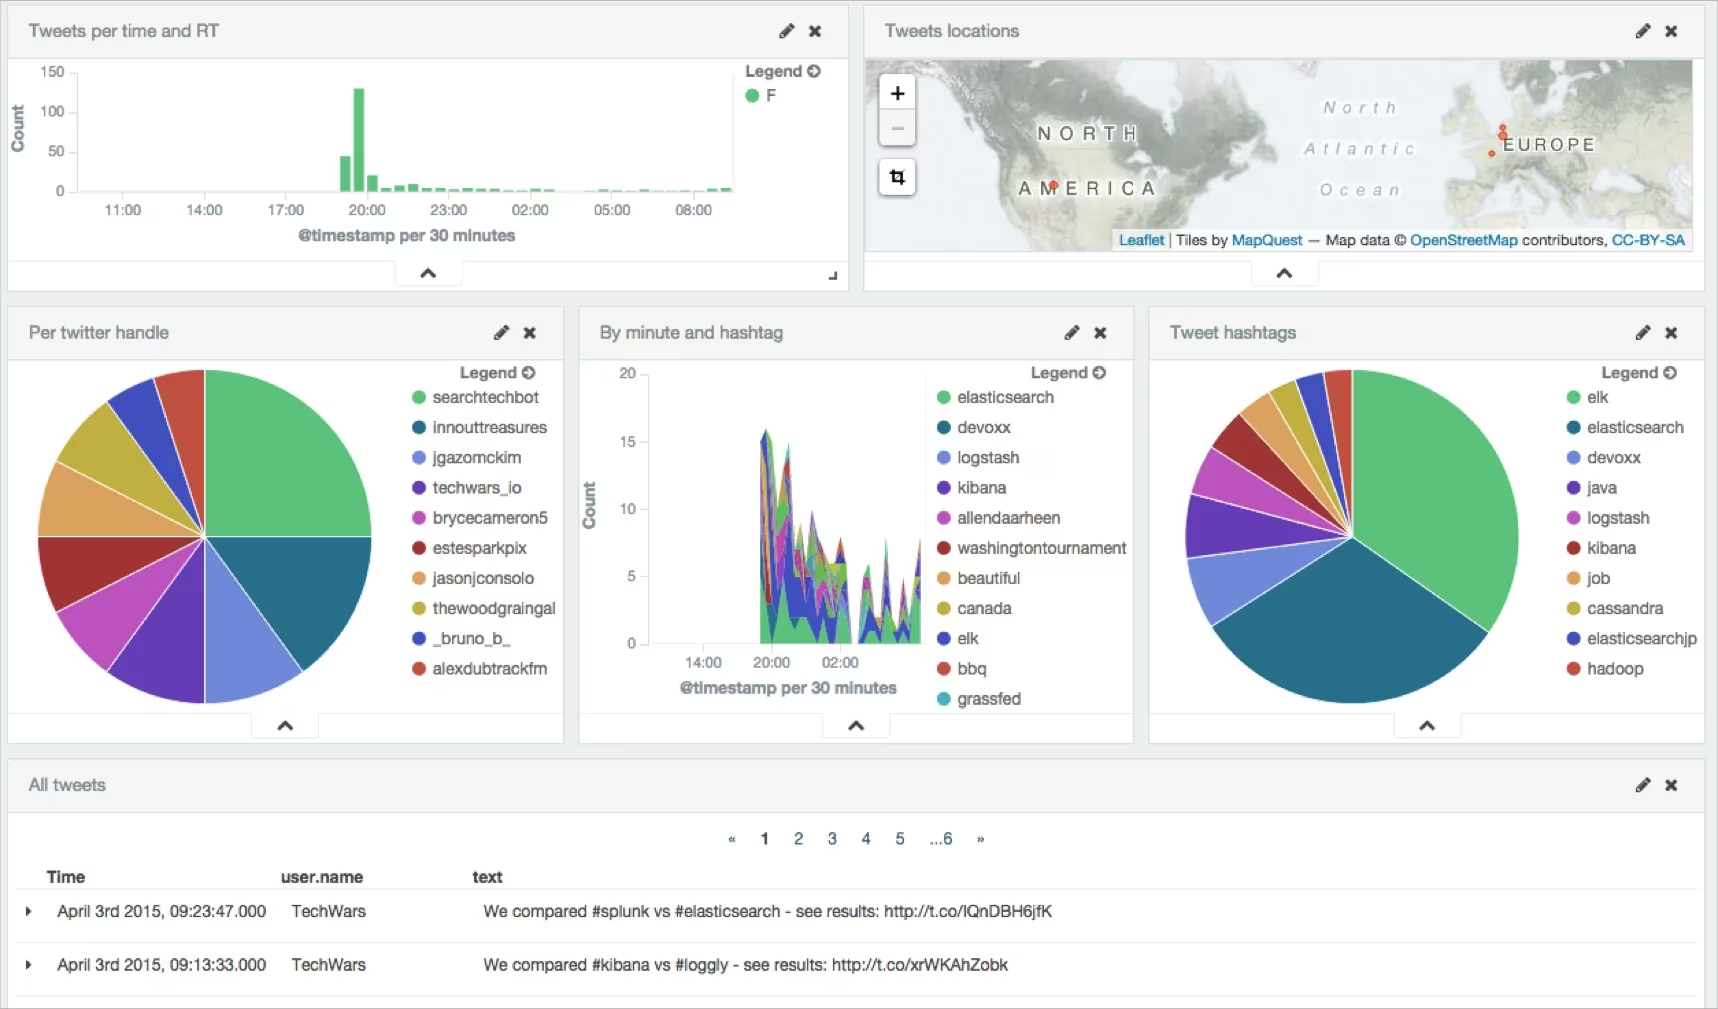
We can now build our Kibana dashboard which represents our logs.
The funny thing with this demo is that we are tracking everything about elk. But ELK does not only mean Elasticsearch, Logstash and Kibana. It’s also an animal
!

ELK
So when US is awake, we often get tweets with other terms like hunt, hunting and so on. But with Kibana, it’s easy to add a “negative” filter on those terms so we can easily get information on what we are actually looking for!

Twitter dashboard
