

I’m often running some demos during conferences where we have a booth. As many others, I’m using Twitter feed as my datasource.
I have been using Twitter river plugin for many years but, you know, rivers have been deprecated .
Logstash 1.5.0 provides a safer and more flexible way to deal with tweets with its twitter input .
Let’s do it!
Let’s assume that you have already elasticsearch 1.5.2, Logstash 1.5.0 and Kibana 4.0.2 running on your laptop or on a cloud instance.
Twitter application
Create first your Twitter application
and open the “Keys and Access Tokens” tab.
Note your consumer_key and consumer_secret (generate them if needed).
Note also your access_token and access_token_secret (generate them if needed).
Logstash configuration
First define your twitter input to track whatever term you want. Let’s say here that I will collect data for the dotScale conference (Elastic sponsors it so if you are around come to say hello at our booth!):
input {
  twitter {
      consumer_key => "consumer_key"
      consumer_secret => "consumer_secret"
      oauth_token => "access_token"
      oauth_token_secret => "access_token_secret"
      keywords => [ "dotscale" ]
      full_tweet => true
  }
}
We won’t do any filtering as tweets come as JSON documents already well formed. We could of course omit some fields but let’s keep that simple:
filter {
}
Connect elasticsearch:
output {
  stdout { codec => dots }
  elasticsearch {
    protocol => "http"
    host => "localhost"
    index => "twitter"
    document_type => "tweet"
    template => "twitter_template.json"
    template_name => "twitter"
  }
}
Elasticsearch template
We have set that we will use a twitter template defined in twitter_template.json:
{
  "template": "twitter",
  "order":    1,
  "settings": {
    "number_of_shards": 1
  },
  "mappings": {
    "tweet": {
      "_all": {
        "enabled": false
      },
      "dynamic_templates" : [ {
         "message_field" : {
           "match" : "message",
           "match_mapping_type" : "string",
           "mapping" : {
             "type" : "string", "index" : "analyzed", "omit_norms" : true
           }
         }
       }, {
         "string_fields" : {
           "match" : "*",
           "match_mapping_type" : "string",
           "mapping" : {
             "type" : "string", "index" : "analyzed", "omit_norms" : true,
               "fields" : {
                 "raw" : {"type": "string", "index" : "not_analyzed", "ignore_above" : 256}
               }
           }
         }
       } ],
      "properties": {
        "text": {
          "type": "string"
        },
        "coordinates": {
          "properties": {
             "coordinates": {
                "type": "geo_point"
             },
             "type": {
                "type": "string"
             }
          }
       }
      }
    }
  }
}
We are basically using something similar to logstash default template but we also disable raw subfield for message field and we define that coordinates.coordinates is actually a geo_point
.
Then, we can start logstash with this configuration and let it run forever…
nohup bin/logstash -f dotscale.conf &
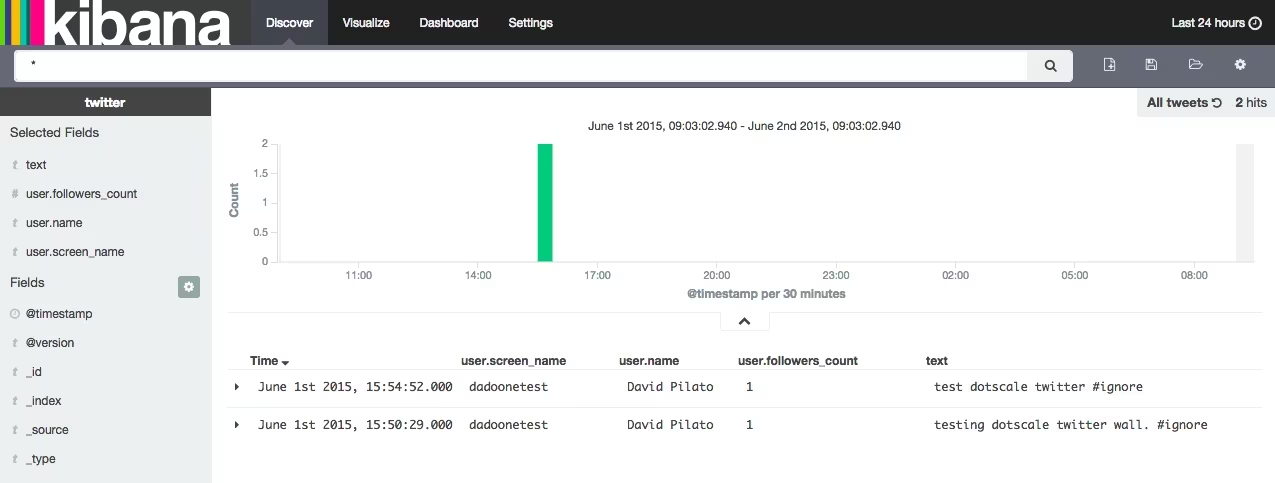
If you send some tweets, you should be able to see them indexed in elasticsearch:
testing dotscale twitter wall. #ignore
— David Pilato (@dadoonetest) June 1, 2015
GET twitter/_search
This should give you some tweets back.
Kibana
And now you can play with Kibana!
Twitter dataset
Open your data (but secure them first)
If you want to share your results, you should secure your elasticsearch instance before opening it to the world!
I tried at first to add a Ngnix layer but I had hard time configuring it. I decided then to use Shield which is a free add-on for elasticsearch customers (yeah we have a fantastic support team who can definitely help you to build the best cluster ever).
Shield has a 30 days evaluation period so here I can use it as I will most likely track data only from few days before the conference and to some days after.
bin/plugin -i elasticsearch/license/latest
bin/plugin -i elasticsearch/shield/latest
Restart elasticsearch.
Then you can a new user who has the default logstash role:
bin/shield/esusers useradd twitter -r logstash
Give whatever password you want…
Modify Logstash configuration as now your elasticsearch output needs to provide credentials:
output {
  elasticsearch {
    protocol => "http"
    host => "localhost"
    index => "twitter"
    document_type => "tweet"
    template => "twitter_template.json"
    template_name => "twitter"
    user => "twitter"
    password => "whateverpasswordyouset"
  }
}
Restart Logstash and you’re done!
You probably want to also create another user who can access to Kibana4:
bin/shield/esusers useradd dadoonet -r kibana4
Set your password. And now you should be able to connect to Kibana4 using your username and password.
Update (after dotScale event)
I finally got this result after one day at dotScale.
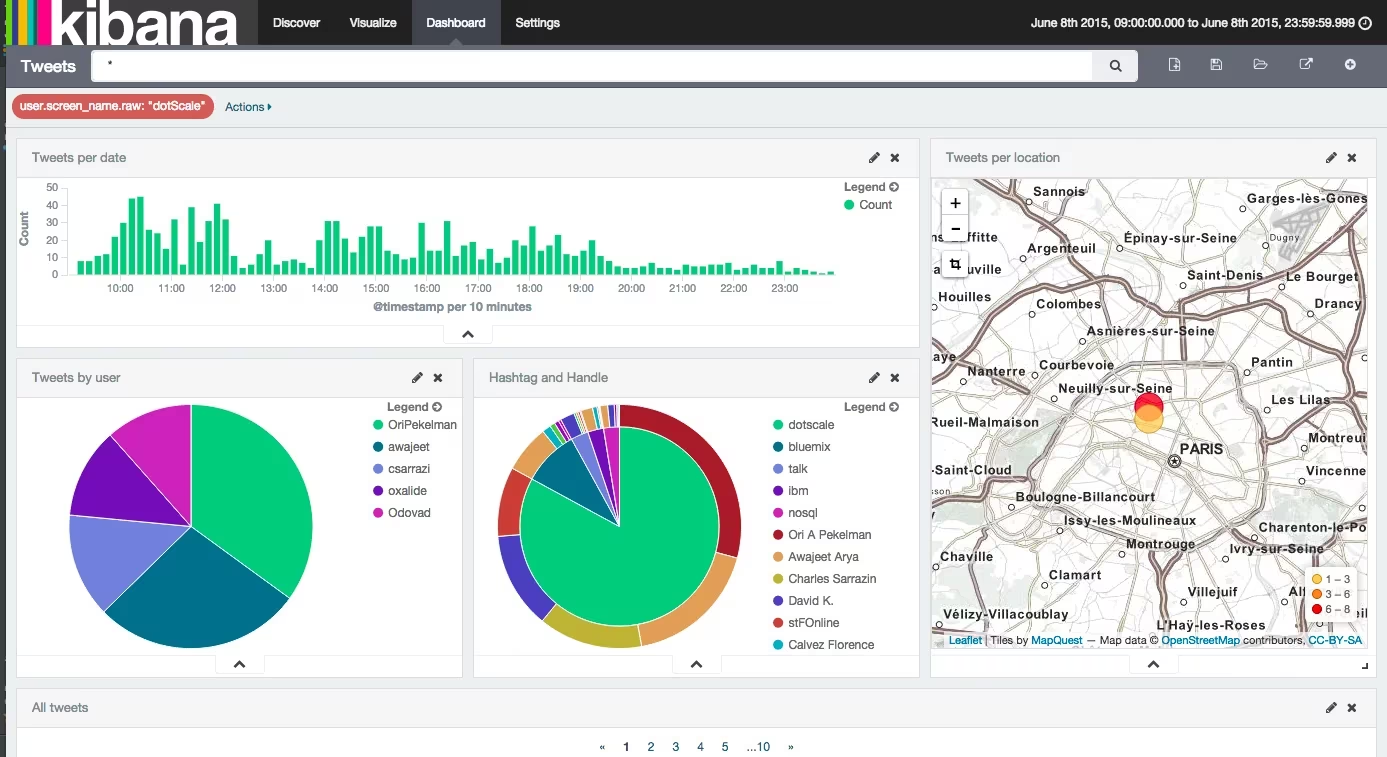
Twitter dataset