Some months ago, I published a recipe on how to index Twitter with Logstash and Elasticsearch .
I have the same need today as I want to monitor Twitter when we run the elastic FR meetup (join us by the way if you are in France!).
Well, this recipe can be really simplified and actually I don’t want to waste my time anymore on building and managing elasticsearch and Kibana clusters anymore.
Let’s use a Found by elastic cluster instead.
Create your cluster
Well. That’s easy. Just connect to Found and create your cluster. Found is always up to date with all the latest elasticsearch versions so here I’m using a 2.0.0 elasticsearch cluster.
Add Kibana 4
In the configuration tab, just activate Kibana 4 and you’re done with Kibana! :D Same here, Kibana is always up to date so I’m using here Kibana 4.2.1 which has just been released yesterday evening!

Activate Kibana 4
Create Shield users
Well, with found you have automatically out of the box all the security needed to operate an elasticsearch cluster in the cloud. You just have to configure it (and it comes with good defaults).
I defined 3 roles:
kibana4admin: can read and write Kibana dashboardskibana4: can read only Kibana dashboardstwitter: can write data to any index which name starts withtwitter-
kibana4admin:
  cluster:
      - cluster:monitor/nodes/info
      - cluster:monitor/health
  indices:
    '*':
      - indices:admin/mappings/fields/get
      - indices:admin/validate/query
      - indices:data/read/search
      - indices:data/read/msearch
      - indices:admin/get
    '.kibana':
      - indices:admin/exists
      - indices:admin/mapping/put
      - indices:admin/mappings/fields/get
      - indices:admin/refresh
      - indices:admin/validate/query
      - indices:data/read/get
      - indices:data/read/mget
      - indices:data/read/search
      - indices:data/write/delete
      - indices:data/write/index
      - indices:data/write/update
      - indices:admin/create

kibana4:
  cluster:
      - cluster:monitor/nodes/info
      - cluster:monitor/health
  indices:
    '*':
      - indices:admin/mappings/fields/get
      - indices:admin/validate/query
      - indices:data/read/search
      - indices:data/read/msearch
      - indices:admin/get
    '.kibana':
      - indices:admin/exists
      - indices:admin/mappings/fields/get
      - indices:admin/validate/query
      - indices:data/read/get
      - indices:data/read/mget
      - indices:data/read/search

twitter:
  cluster:
    - indices:admin/template/get
    - indices:admin/template/put
  indices:
    '*':
      - indices:data/write/bulk
    'twitter':
      - indices:admin/create
      - indices:data/write/index
I add 3 users:
kibana: password1
kibanaadmin: password2
logstash: password3
And I map my roles and users:
kibana4: kibana
kibana4admin: kibanaadmin
twitter: logstash
Just save the configuration and everything in found is now set up!
Get data from Twitter
For now, found does not run Logstash clusters so for that part, so I will build my own instance on AWS here. But note that it can run from whatever cloud provider you want.
Twitter application
Create your Twitter application
and open the “Keys and Access Tokens” tab.
Note your consumer_key and consumer_secret (generate them if needed).
Note also your access_token and access_token_secret (generate them if needed).
Logstash
On the instance, I install logstash :
wget https://download.elastic.co/logstash/logstash/logstash-2.0.0.tar.gz
tar xzf logstash-2.0.0.tar.gz
Then I create an elasticsearch template file as explained in my previous post :
{
  "template": "twitter*",
  "order":    1,
  "settings": {
    "number_of_shards": 1
  },
  "mappings": {
    "tweet": {
      "_all": {
        "enabled": false
      },
      "dynamic_templates" : [ {
         "message_field" : {
           "match" : "message",
           "match_mapping_type" : "string",
           "mapping" : {
             "type" : "string", "index" : "analyzed", "omit_norms" : true
           }
         }
       }, {
         "string_fields" : {
           "match" : "*",
           "match_mapping_type" : "string",
           "mapping" : {
             "type" : "string", "index" : "analyzed", "omit_norms" : true,
               "fields" : {
                 "raw" : {"type": "string", "index" : "not_analyzed", "ignore_above" : 256}
               }
           }
         }
       } ],
      "properties": {
        "text": {
          "type": "string"
        },
        "coordinates": {
          "properties": {
             "coordinates": {
                "type": "geo_point"
             },
             "type": {
                "type": "string"
             }
          }
       }
      }
    }
  }
}
Then I create my logstash configuration file meetup_fr.conf. I will track everything about elasticfr:
input {
  twitter {
      consumer_key => "consumer_key"
      consumer_secret => "consumer_secret"
      oauth_token => "access_token"
      oauth_token_secret => "access_token_secret"
      keywords => [ "elasticfr" ]
      full_tweet => true
  }
}

filter {
}

output {
  stdout { codec => dots }
  elasticsearch {
    ssl => true
    hosts => [ "MYCLUSTERONFOUND.found.io:9243" ]
    index => "twitter_meetup_fr_201511"
    document_type => "tweet"
    template => "twitter_template.json"
    template_name => "twitter"
    user => "logstash"
    password => "password3"
  }
}
Then, just launch logstash:
./logstash-2.0.0/bin/logstash -f meetup_fr.conf
Tweet!
Don't forget our next @ElasticFR meetup! See you there guys! :D #elasticfr https://t.co/SO2KxdEbv5
— David Pilato 🇺🇦🇪🇺🇫🇷 (@dadoonet) November 17, 2015
Understand your data
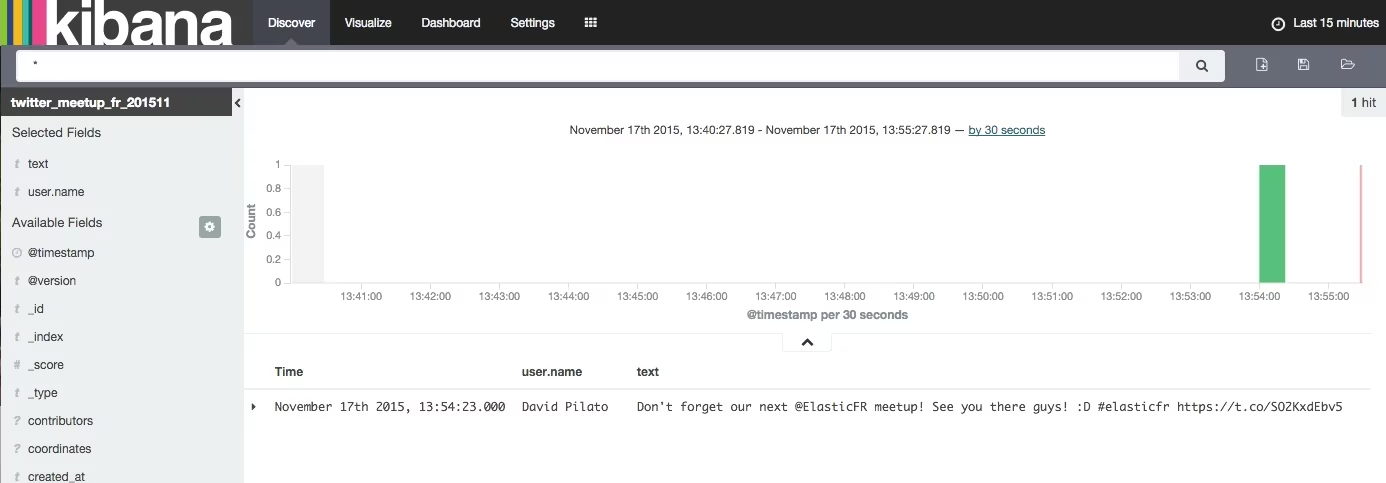
Well, just open your Kibana 4 instance which is running on found and build as usual your dashboards.
Our tweet is here!

Tweet is here
